Performance work has a way of ending up at the bottom of the backlog. There’s always something more urgent — a new feature, a bug, a deadline. I’ve been experimenting with a format I’m calling a Lightning Audit: set a timer, open DevTools, and see what jumps out in a fixed, time-boxed window. The goal is to start somewhere in hopes of showing that a minimum effective dose of performance work can help move the needle over time. If we have wins to celebrate, eventually performance might start getting more attention.
For the first audit, I chose kroger.com, a grocery retailer in the US that is headquartered about 30 minutes from my house in Cincinnati, Ohio. This isn’t intended to be a takedown; I actually shop there every week and have family members who worked there for many years. I want to use this as an illustration.
A site with a lot going for it
Kroger is a top 10k site globally by traffic. They operate mostly in the US, which means a relatively concentrated user base. They have a premium Real User Monitoring (RUM) tool installed, so they have visibility into how real users experience the site. They have invested heavily in a large digital practice supported by multiple engineering teams staffed by full-time employees and contractors. On paper, a lot is working in their favor.
Video audit
This is the original audit I ran so you can watch in full. I will summarize the key findings below.
Watch on YouTube.
Key findings
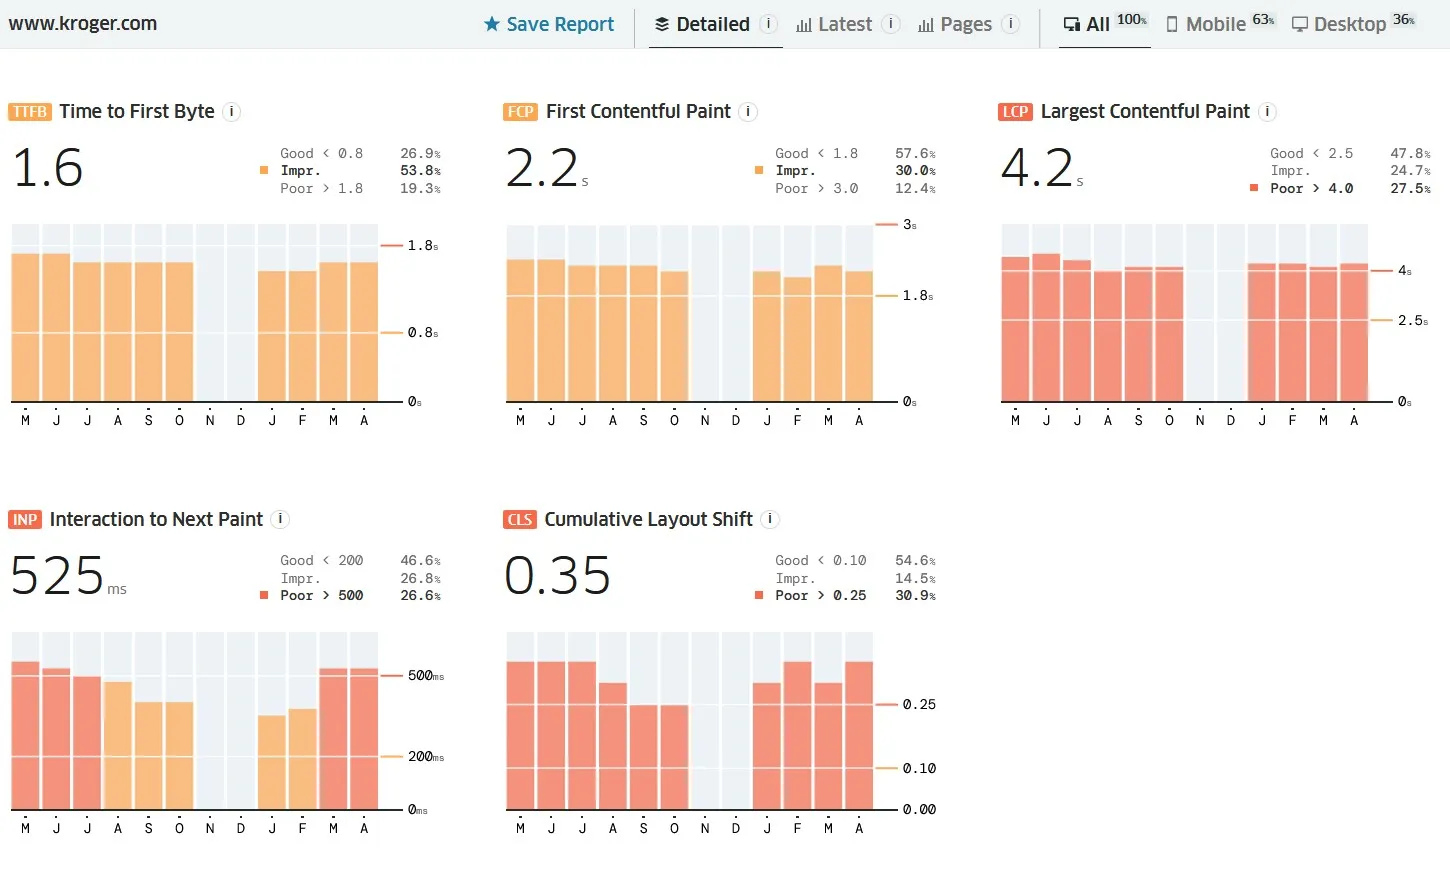
Despite all the positive things that the site has going for it, every single Core Web Vitals metric comes back with a qualitative label of “poor.”
Since the site has monitoring infrastructure in place, it’s likely that someone within the organization knows the extent of the performance issues. Tools like RUM don’t end up on a site without getting budget approval and making a case for it, so I believe there are teams that care and want to fix things. More than likely, there are competing priorities within the organization that influence the product that gets shipped to users.
Groceries are a necessity that everyone needs, and the CrUX data showed that there are a lot of people getting a less than optimal experience. Here are the objective numbers from the audit:
- 63% of Kroger’s traffic is mobile
- 570 total requests and 19MB of transfer size
- JavaScript accounted for 67 requests and 2.5MB of transfer
- The p75 numbers were:
- LCP: 4.2s
- INP: 525ms
- CLS: 0.35
The preload problem
In the 10 minutes I spent auditing the site, I was able to find several areas for improvement, but preloads were most interesting because it indicates how the organizational dynamics show up in the real world.
Here’s what Kroger is preloading:
- 4 fonts: a design and brand dependency
- A consent management tool: a legal requirement
- Their tag manager: a marketing dependency
- A digital coupon service: another marketing dependency
None of those resources help the user accomplish what they came to the page to do, which is to find items in-store or online. For example, the hero image isn’t preloaded and neither are the critical JS bundles that are needed to assemble the UI.
The home page was also quite long. There were promos for the pharmacy, summer picnic foods, memberships to their shopping club, sale items, digital deals, and weight loss supplements. A home page is highly subject to office politics because everyone in an organization wants real estate and visibility for the areas they’re responsible for, and I understand where they’re coming from. Sometimes, the home page serves a stakeholder peacekeeping device as much as it does a user’s entry point to a site.
However, it’s worth asking “what does the user need first,” and there needs to be a glue layer between the user and the organization.
What 10 minutes told me
This is the real point of the exercise. I didn’t run Lighthouse. I didn’t use WebPageTest. I didn’t analyze bundle sizes or run a coverage report. I opened DevTools, scrolled the page, and looked at a couple of headers.
In that time, a clear picture emerged:
- The page is very heavy for a primarily mobile audience
- Preload priorities reflect internal stakeholder influence
- Layout shift is happening in the carousel and is fixable at the component level
- Cache settings have room for improvement
- Long tasks are present and profiling showed meaningful self-time on first-party code
The biggest takeaway is that a site with real monitoring tools, real traffic, and real infrastructure investment can still have deeply addressable performance problems. Performance problems are usually organizational before they’re technical, and that is showing up here.
The Lightning Audit format works because the time constraint forces prioritization. You can’t look at everything, so you look at what’s most visible. More of these to come.